Some time back, I wrote about self-hosting OpenStreetMaps widgets. However, since then, some of the techniques I discussed are no longer valid or necessary. Hence, I've put together this update.
Why self-host map widgets?
Why host an interactive map yourself when it's easy to embed one using Mapbox or Google Maps?
I prefer to have the map data hosted on my own server, as it means I don't have to worry about third-party providers. This makes it easier for me to customize or migrate my website.
Additionally, I don't have to worry about the privacy or GDPR compliance of a third-party provider.
Recently, I stumbled upon Protomaps, a new file format designed for efficiently storing map data. It makes the process of publishing and self-hosting OpenStreetMaps map widgets much simpler.
To self-host a map using Protomaps, you can follow these steps:
- determine the desired map outline
- download the corresponding map material
- integrate and display the map material on a website
- (optional) customize the map style
Step 1: Determining the map outline
Let's start by creating a new folder for our project, where we'll keep all the important data throughout this tutorial.
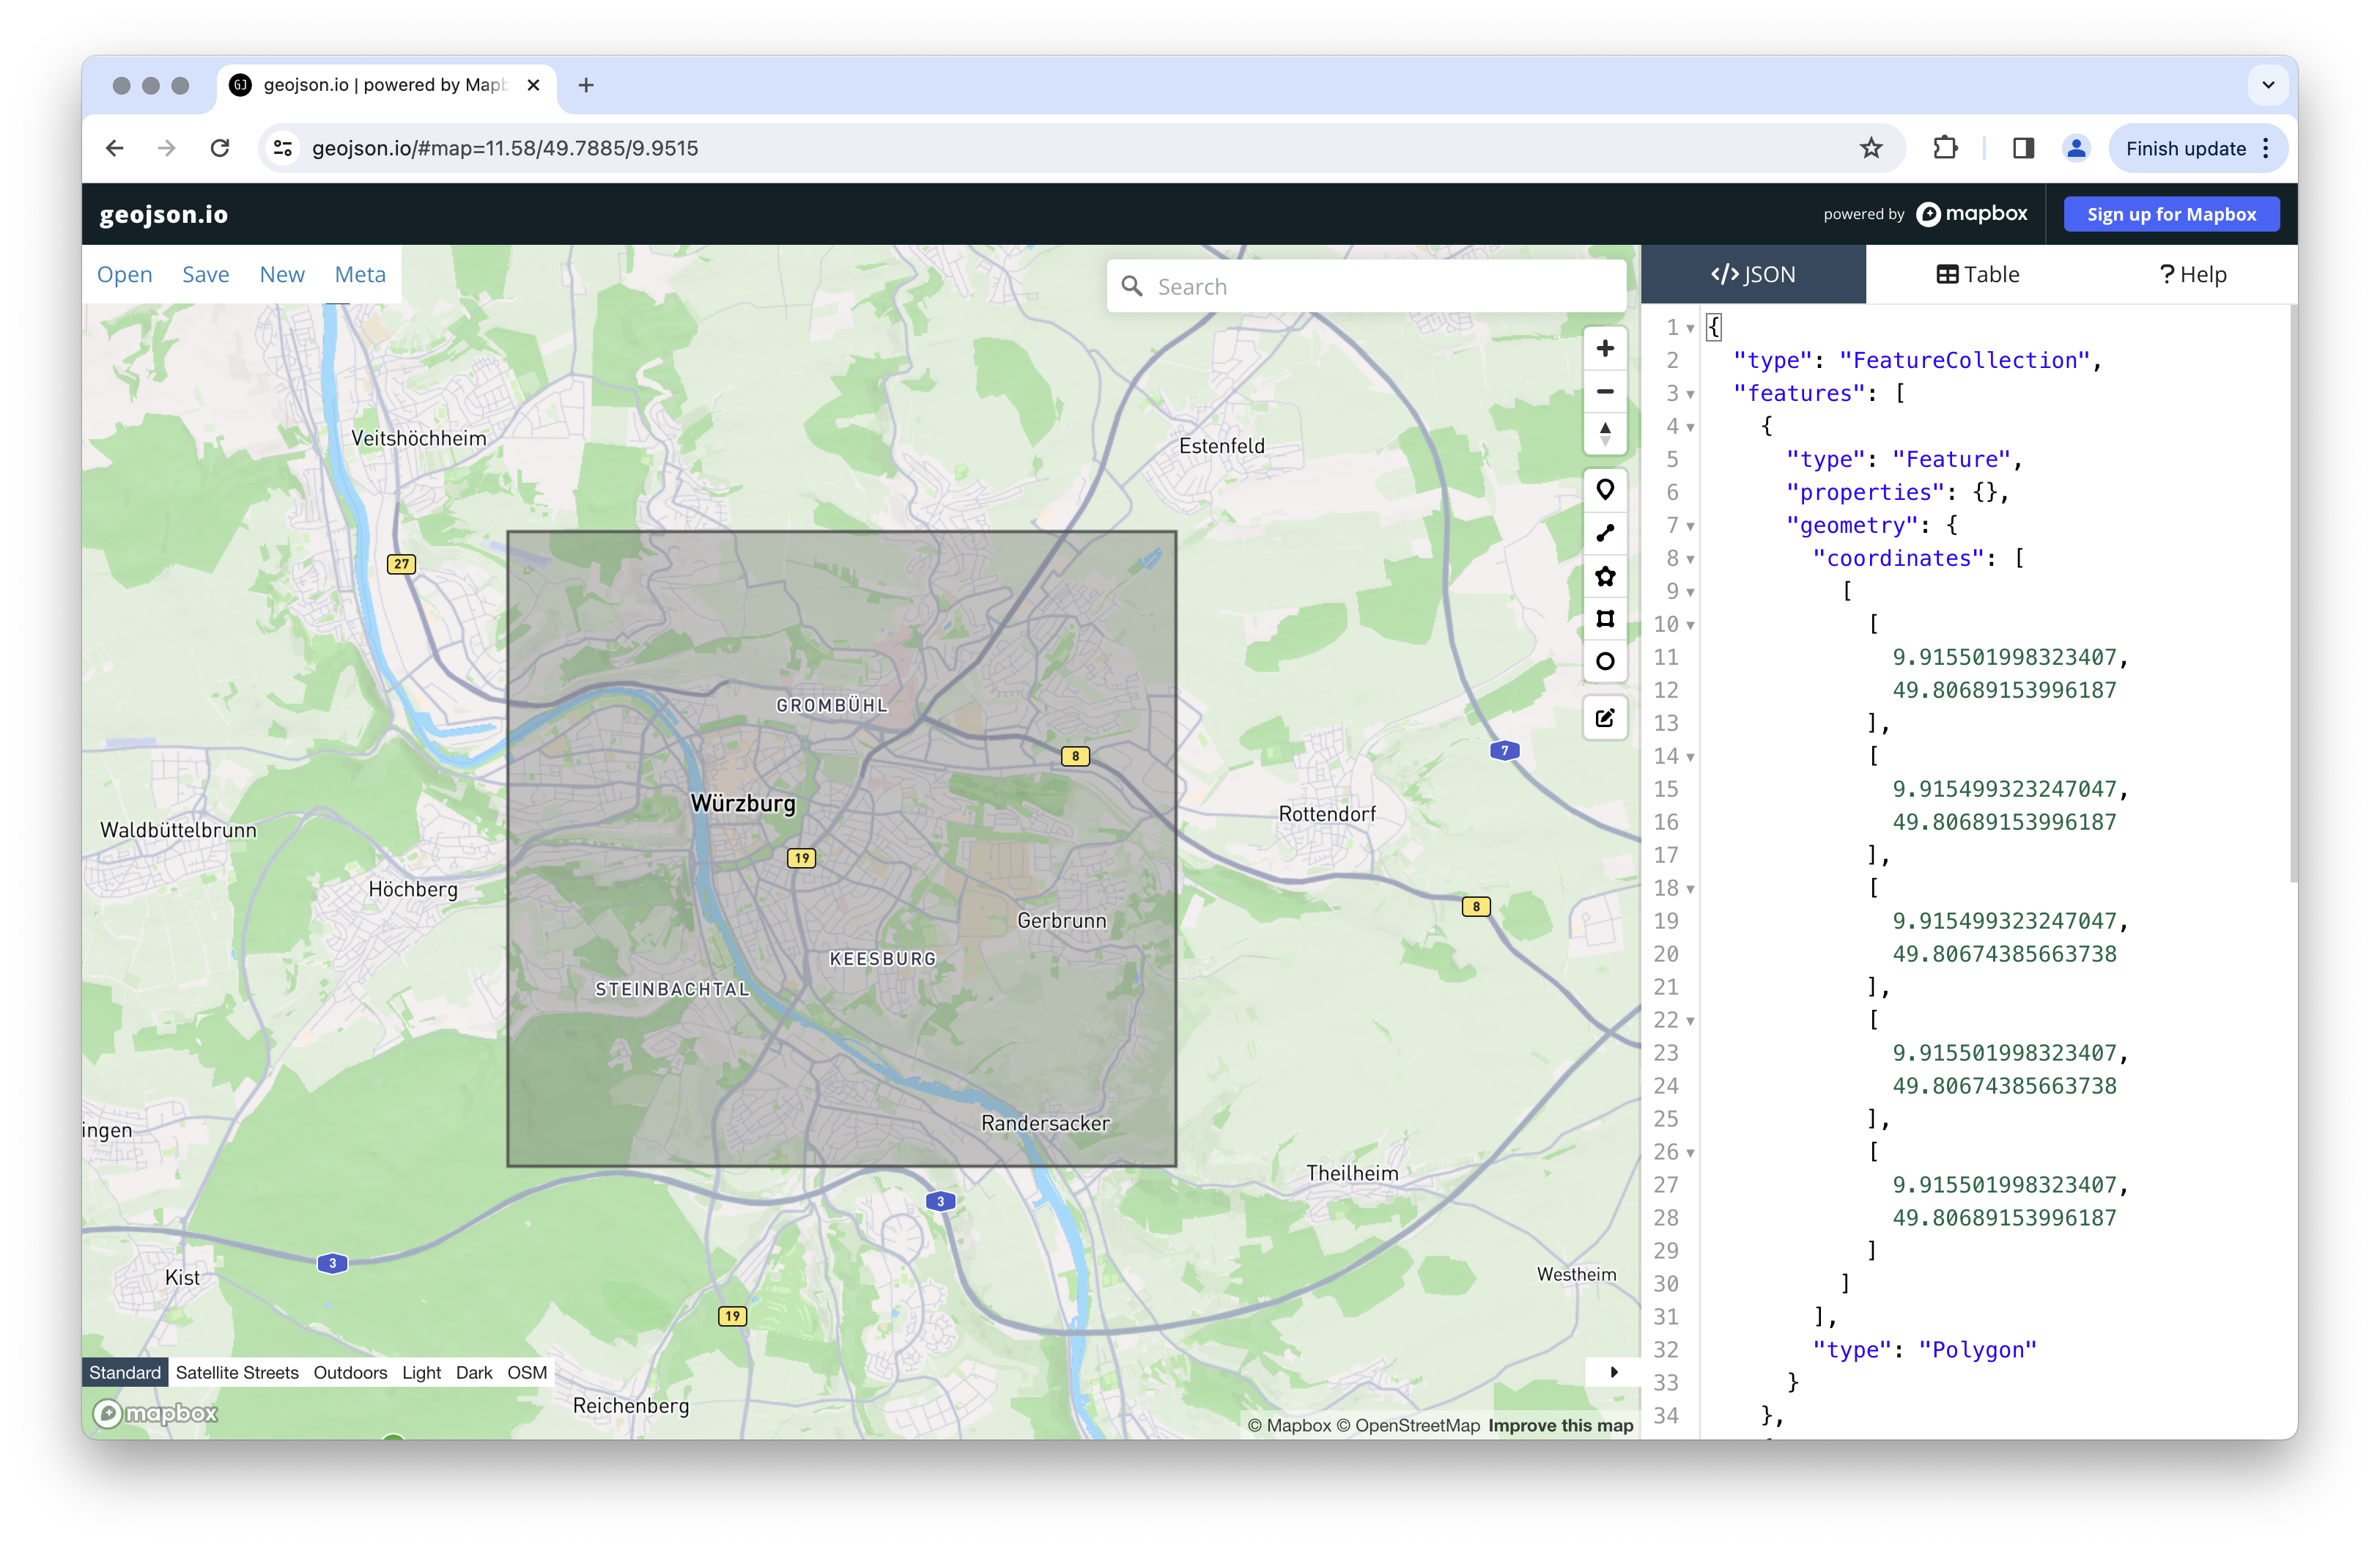
First, we will define the outline of our map and save it as a file. We will then use this outline in the next step to download the appropriate map data.
It's essential to consider the size of your outline, as it determines the amount of map data to be downloaded and the storage space required. Starting with a smaller outline, around 10 x 10 km, is advisable.
We'll describe this outline using the GeoJSON format and save it as a .geojson file in our project folder.
The graphical editor geojson.io is free and allows us to create and edit a GeoJSON file:

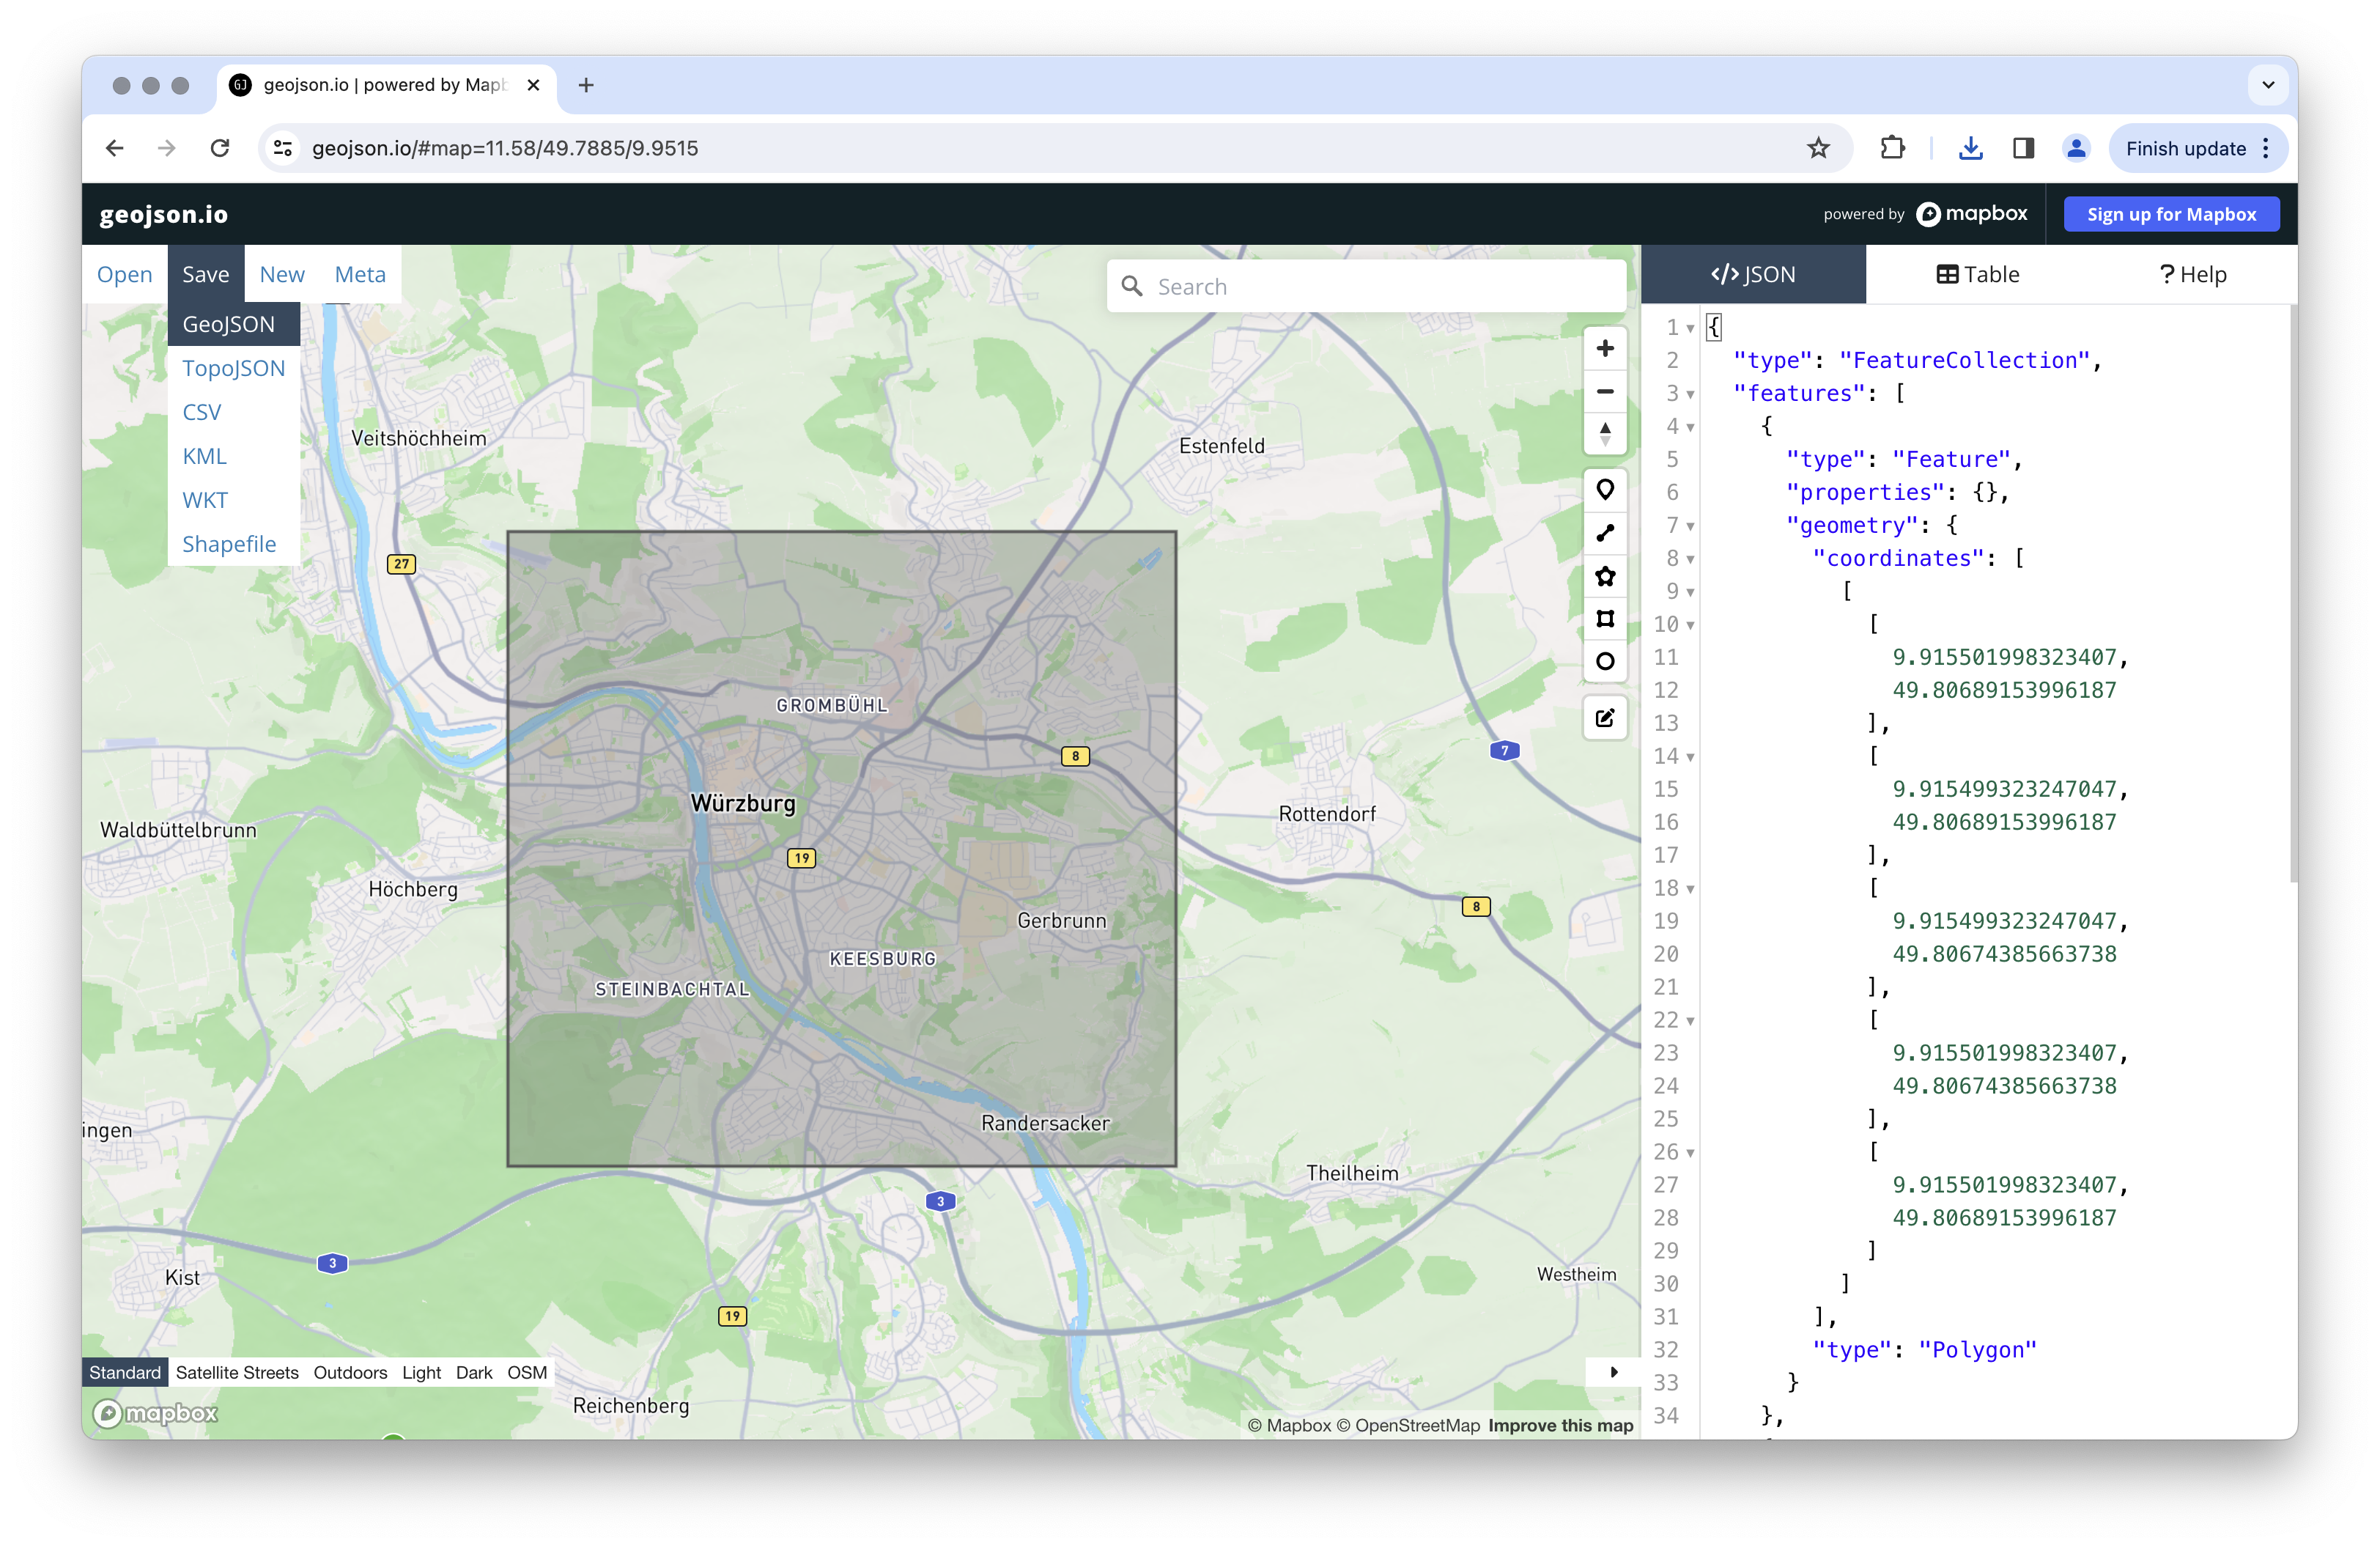
Under Save > GeoJSON we can download the file. We then save it to our project folder and rename it to bounds.geojson.

At this point, our project folder should look like this:
.
└── bounds.geojson
Alternatively, it is of course also possible to create the GeoJSON file manually or with other editors.
Step 2: Downloading the map data
Now that we've saved the map outline to a file, we're ready to download the map data.
Protomaps provides OpenStreetMaps map data in their file format. However, the datasets available on Protomaps' builds page cover the entire world and are quite large, spanning many gigabytes. For most map applications, a smaller section of the map is sufficient.
To download the map section defined in Step 1, we'll use a command-line tool called go-pmtiles.
You can download go-pmtiles from its GitHub Releases page. On the page, you'll find various files listed. Choose the appropriate zip file for your operating system and unpack it.
Inside the downloaded zip archive, we'll find an executable file named pmtiles. We place this file in our project folder:
.
├── bounds.geojson
└── pmtiles
Once we have successfully downloaded the go-pmtiles tool, we can proceed to download the map data.
On the Protomaps Builds page we'll find a list with the latest map data. We select the latest version and download the data for our map section.
To do this, we first copy the link address of the download link (in my case, for example, https://build.protomaps.com/20231002.pmtiles).
We then use this link address in our terminal command to download the map data:
./pmtiles extract https://build.protomaps.com/20231002.pmtiles mapdata.pmtiles --region=bounds.geojsonAfter a short time, the data should be downloaded...
fetching 9 dirs, 9 chunks, 8 requests
Region tiles 165, result tile entries 165
fetching 165 tiles, 28 chunks, 20 requests
fetching chunks  11% |██                 | (567 kB/4.9 MB, 43 kB/s) [17s:1m44s]
Our project folder should then look like this:
.
├── bounds.geojson
├── mapdata.pmtiles
└── pmtiles
This completes the download of the map data and we can now proceed to display the map data on a website.
Step 3: Integrate and display map data on the website
We will use the JavaScript library Maplibre GL JS to integrate the map.
We download the following JavaScript and CSS files and save them in our project folder:
- https://unpkg.com/maplibre-gl@latest/dist/maplibre-gl.js under
assets/js/maplibre-gl.js - https://unpkg.com/maplibre-gl@latest/dist/maplibre-gl.css under
assets/css/maplibre-gl.js - https://unpkg.com/pmtiles@2.11.0/dist/index.js under
assets/js/pmtiles.js
We also move the file mapdata.pmtiles to the assets folder.
The contents of the project folder should now look something like this:
.
├── assets
│   ├── css
│   │   └── maplibre-gl.css
│   ├── js
│   │   ├── maplibre-gl.js
│   │   └── pmtiles.js
│   └── mapdata.pmtiles
├── bounds.geojson
└── pmtiles
Next, we create a simple_map.html file with the following content in our project folder:
<!DOCTYPE html>
<html>

<head>
    <meta charset="utf-8" />
    <title>Protomaps Simple Map Example</title>
</head>

<body>
    <link rel="stylesheet" href="assets/css/maplibre-gl.css" />
    <style>
        /* Make the map container take all available space on the page */
        #my_map {
            position: absolute;
            top: 0;
            left: 0;
            width: 100svw;
            height: 100svh;
        }
    </style>
    <div id="my_map"></div>
    <script src="assets/js/maplibre-gl.js"></script>
    <script src="assets/js/pmtiles.js"></script>
    <script type="module">
        // add the PMTiles plugin to the maplibregl global.
        const protocol = new pmtiles.Protocol();
        maplibregl.addProtocol('pmtiles', (request) => {
            return new Promise((resolve, reject) => {
                const callback = (err, data) => {
                    if (err) {
                        reject(err);
                    } else {
                        resolve({ data });
                    }
                };

                protocol.tile(request, callback);
            });
        });

        // the location of our pmtiles file
        const PMTILES_URL = './assets/mapdata.pmtiles';

        // create a new PmTiles instance
        const pmtilesInstance = new pmtiles.PMTiles(PMTILES_URL);

        // this is so we share one instance across the JS code and the map renderer
        protocol.add(pmtilesInstance);

        // we first fetch the header so we can get the center lon, lat of the map.
        const mapMetaData = await pmtilesInstance.getHeader();

        const map = new maplibregl.Map({
            // sets the element we want to add our map to
            container: document.querySelector('#my_map'),

            // set the initial center of the map to the center
            // of the map data
            center: [mapMetaData.centerLon, mapMetaData.centerLat],

            // sets the initial zoom of the map according to the
            // map zoom
            zoom: mapMetaData.maxZoom - 2,

            style: {
                version: 8,

                // ading protomaps as the data source for our map
                sources: {
                    'protomaps': {
                        type: 'vector',
                        url: `pmtiles://${PMTILES_URL}`,
                        attribution: '© <a href="https://openstreetmap.org">OpenStreetMap</a>'
                    }
                },

                // simple map layer definitions
                // for more information about structure see
                // https://maplibre.org/maplibre-style-spec/layers/
                layers: [
                    {
                        'id': 'buildings',
                        'source': 'protomaps',
                        'source-layer': 'landuse',
                        'type': 'fill',
                        'paint': {
                            'fill-color': '#0066ff'
                        }
                    },
                    {
                        'id': 'roads',
                        'source': 'protomaps',
                        'source-layer': 'roads',
                        'type': 'line',
                        'paint': {
                            'line-color': 'black'
                        }
                    },
                    {
                        'id': 'mask',
                        'source': 'protomaps',
                        'source-layer': 'mask',
                        'type': 'fill',
                        'paint': {
                            'fill-color': 'white'
                        }
                    }
                ]
            }
        });
    </script>
</body>

</html>
If we upload the project folder to a web server (or start a web server in this folder) and then open the simple_map.html file in the browser, our map will now be displayed. (Important: the web server must support HTTP Range Requests).
Step 4: Customize map display
We can define and enhance the visual map display using style rules. These rules allow us to customize elements such as building colors or street markings. More detailed explanations of these style rules can be found on the Maplibre page.
Protomaps kindly provides some ready-made map styles. These can be tried out, adapted and copied on the test page. We save the map style in our project folder as a file under assets/map_style.json.
In addition to the map data, fonts in .pbf format are also required for the text display. These can also be downloaded from the basemaps-assets Repository of Protomaps on GitHub (or simply click this link). We also add the included fonts folder to our project folder, under /assets.
Alternatively, we could use the online tool Maplibre Font Maker to convert our font files (.ttf, .otf) into the .pbf format.
.
├── assets
│   ├── css
│   │   └── maplibre-gl.css
│   ├── fonts
│   │   └── ... (sehr viele .pbf-Dateien)
│   ├── js
│   │   ├── maplibre-gl.js
│   │   └── pmtiles.js
│   ├── map_style.json
│   └── mapdata.pmtiles
├── bounds.geojson
├── pmtiles
└── simple_map.html
Next, we create a new file called styled_map.html in our project folder with the following content:
<!DOCTYPE html>
<html>

<head>
    <meta charset="utf-8" />
    <title>Protomaps Styled Map Example</title>
</head>

<body>
    <link rel="stylesheet" href="assets/css/maplibre-gl.css" />
    <style>
        /* Make the map container take all available space on the page */
        #my_map {
            position: absolute;
            top: 0;
            left: 0;
            width: 100svw;
            height: 100svh;
        }
    </style>
    <div id="my_map"></div>
    <script src="assets/js/maplibre-gl.js"></script>
    <script src="assets/js/pmtiles.js"></script>
    <script type="module">
        // dynamically loads the 'map_style.json' file and then
        // gets the layers array from it
        // we could also add this data inline and skip this fetch call,
        // but we add it here to maintain readability
        const { layers } = await fetch('./assets/map_style.json').then(res => res.json());

        // add the PMTiles plugin to the maplibregl global.
        const protocol = new pmtiles.Protocol();
        maplibregl.addProtocol('pmtiles', (request) => {
            return new Promise((resolve, reject) => {
                const callback = (err, data) => {
                    if (err) {
                        reject(err);
                    } else {
                        resolve({ data });
                    }
                };

                protocol.tile(request, callback);
            });
        });

        // the location of our pmtiles file
        const PMTILES_URL = './assets/mapdata.pmtiles';

        // create a new PmTiles instance
        const pmtilesInstance = new pmtiles.PMTiles(PMTILES_URL);

        // this is so we share one instance across the JS code and the map renderer
        protocol.add(pmtilesInstance);

        // we first fetch the header so we can get the center lon, lat of the map.
        const mapMetaData = await pmtilesInstance.getHeader();

        const map = new maplibregl.Map({
            // sets the element we want to add our map to
            container: document.querySelector('#my_map'),

            // set the initial center of the map to the center
            // of the map data
            center: [mapMetaData.centerLon, mapMetaData.centerLat],

            // sets the initial zoom of the map according to the
            // map zoom
            zoom: mapMetaData.maxZoom - 2,

            style: {
                version: 8,

                // ading protomaps as the data source for our map
                sources: {
                    'protomaps': {
                        type: 'vector',
                        url: `pmtiles://${PMTILES_URL}`,
                        attribution: '© <a href="https://openstreetmap.org">OpenStreetMap</a>'
                    }
                },

                // adding the map layers (the visual styles)
                layers,
                // the location of our font files
                glyphs: './assets/fonts/{fontstack}/{range}.pbf'
            }
        });
    </script>
</body>

</html>
When we open this file in the browser, it will look something like this:
With our self-hosted map as a basis, all paths are open to us: On the website of MapLibre there are various examples of what you can do with your self-hosted map.
A simple example: The visualization of a GPX file