This article is out of date and has been updated. You can find the latest version here.
In this article I'm going to show how you can easily self-host interactive OpenStreetMaps maps, without including any code from third-party providers (e.g. MapBox, GoogleMaps), or sending any requests to them.
Please note: This description is limited to the creation of a small map section in many zoom levels, in order to keep data volumes and processing times at a minimum. The creation of a map of Europe map or the world technically works just the same, though it requires significantly more processing time and storage space.
This article describes the creation of vector tiles on MacOS, as well as the hosting via Apache + PHP.
Scope of functions
What is the functionality of the self-created and hosted maps described here?
- Interactive map view with zoom and pan
- Small map sections: A detailed map (with many zoom levels) of Europe or the world is (depending on your budget) probably way too big to self-host
- Set map overlays and pins
- Generally the functionality of MaplibreGL
- Hosting either on PHP + Apache (described here) or on Node.js
What can these self-hosted maps not do?
- Navigation and routing
- Geocoding: i.e. convert an address to geocoordinates or convert coordinates to address
- other complex calculations that rely on a backend server
- Generally everything that is not within the functionality of MaplibreGL :-)
Necessary steps
Two steps are necessary to create and display the map:
- Generate map data in vector tile file format from Openstreetmap data.
- Host and display vector files and display them in a web application.

Step 1: Creation of Vector Tile files
Vector Tiles allow for a scalable map display: the maps do not "pixelate" when zooming.
The vector tiles files are generated from Open Steet Map map information. The following command line tools will be used:
Download map data
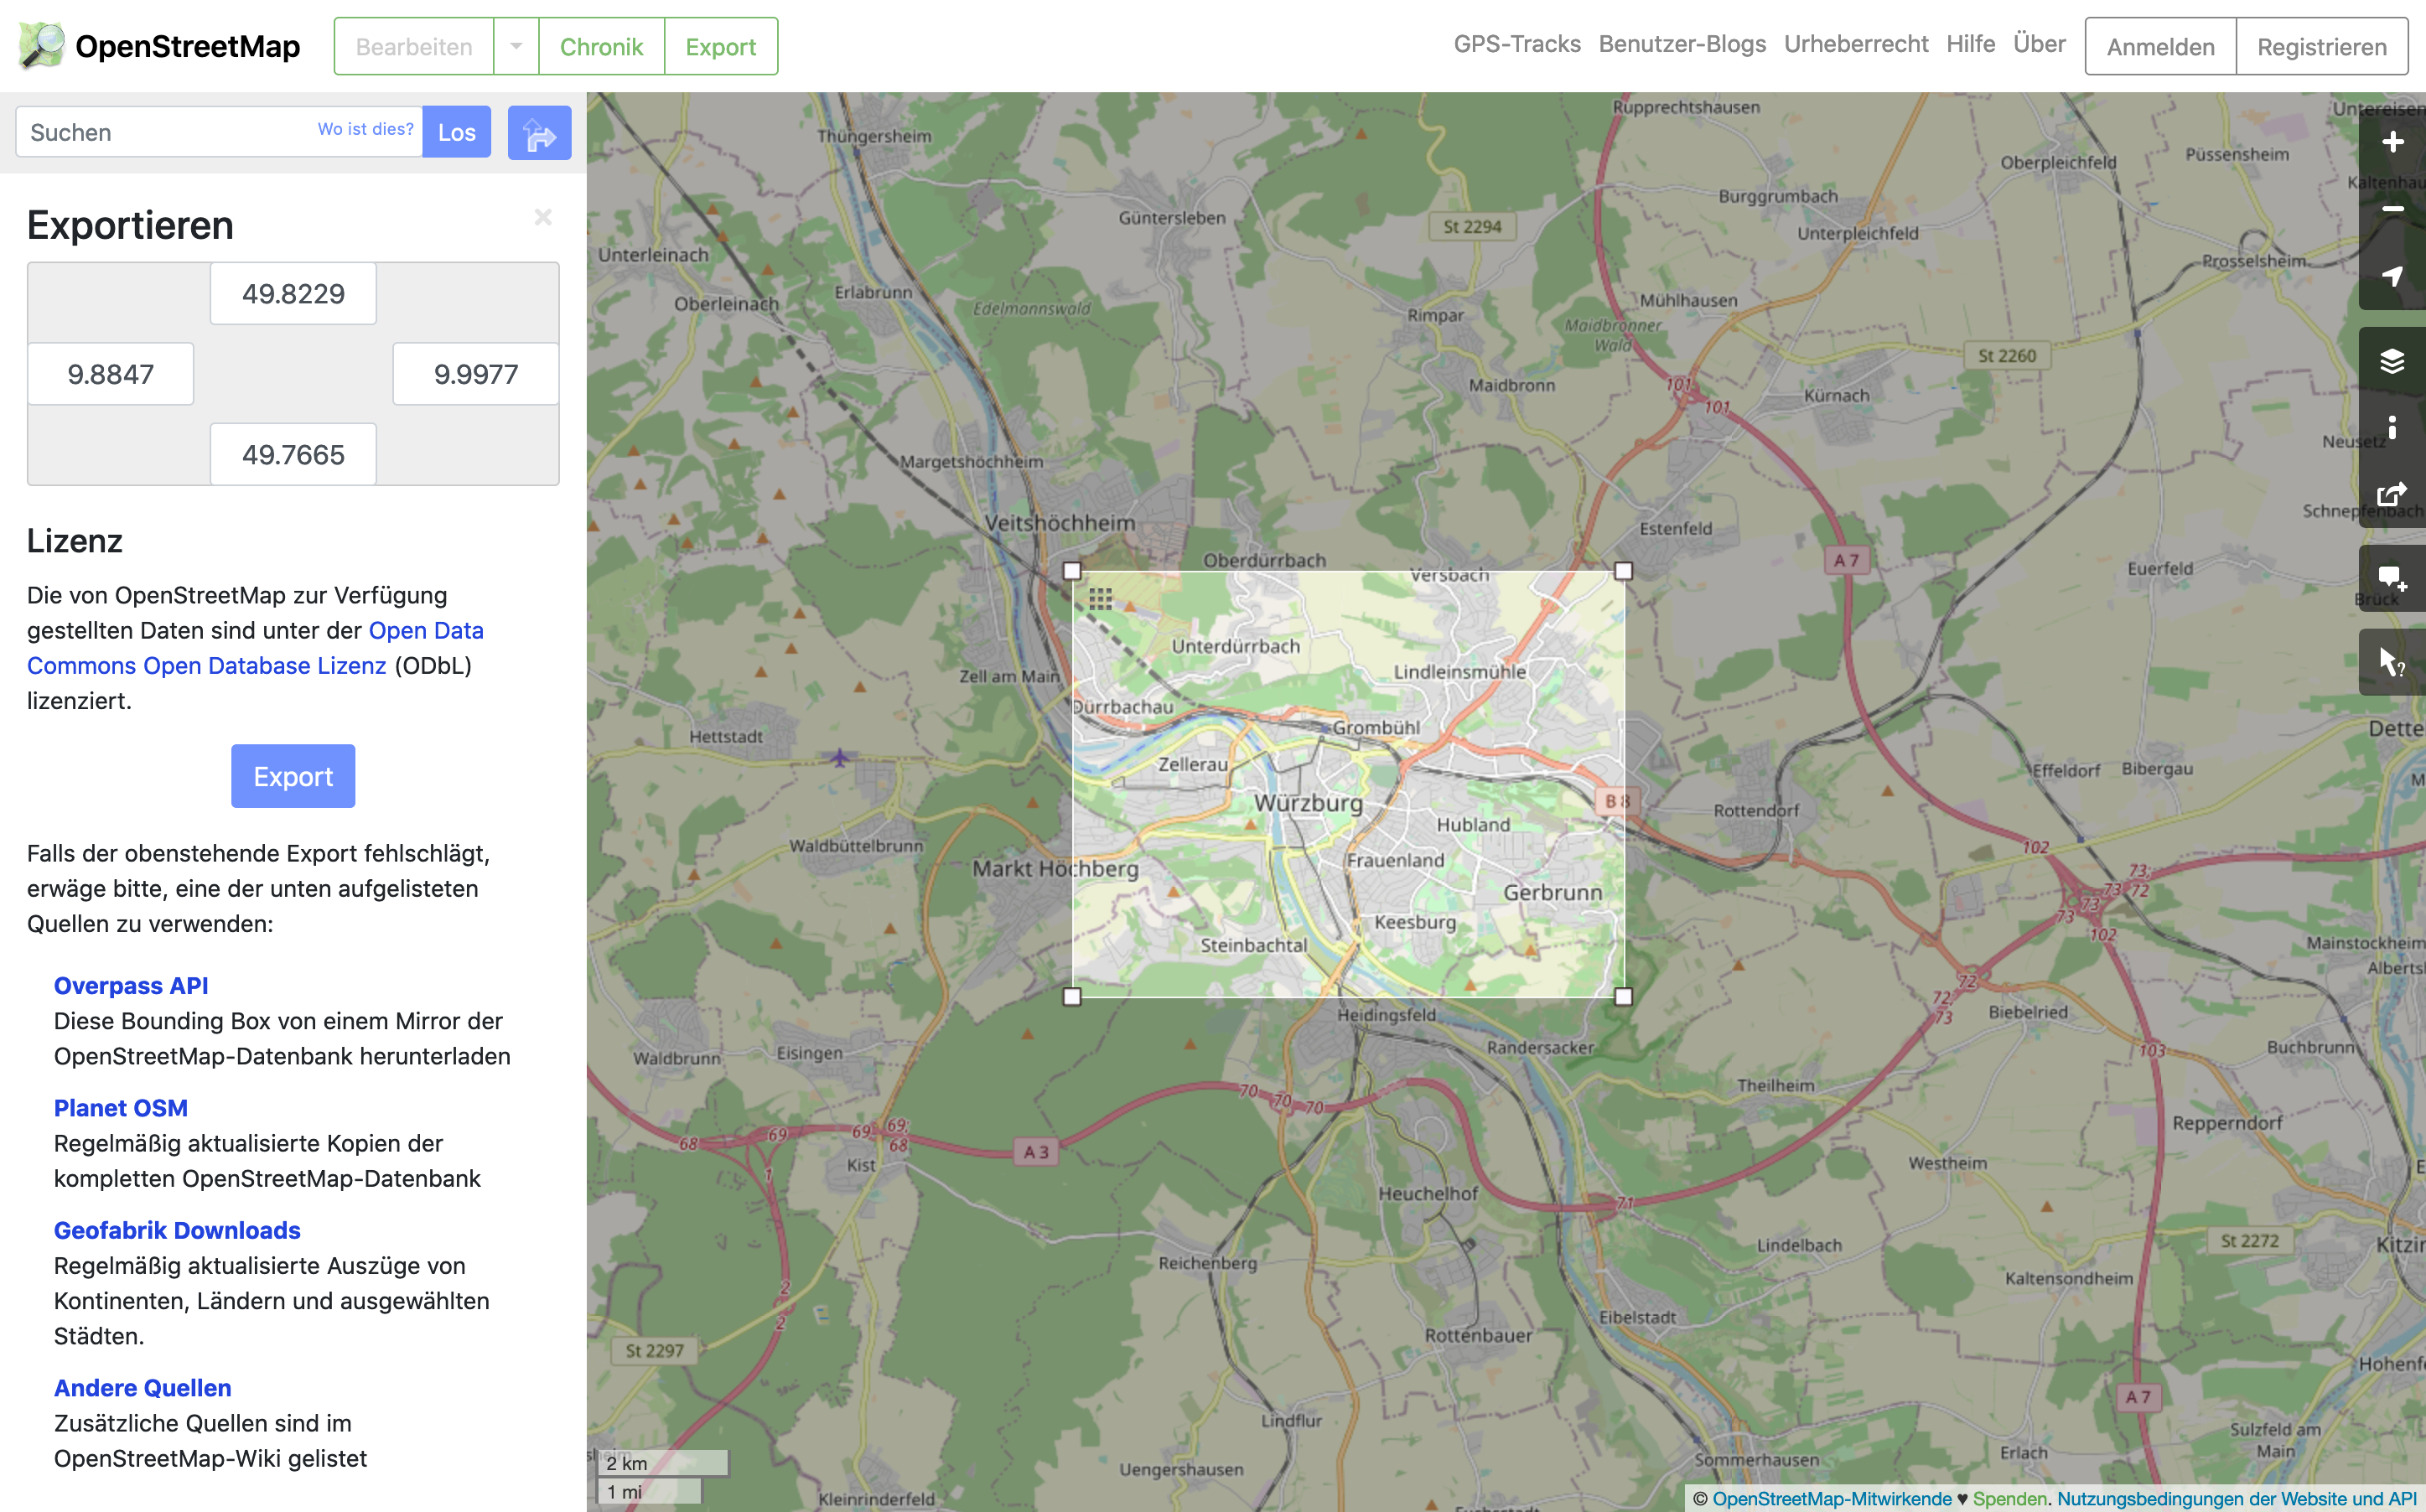
The OpenStreetMap map data can be downloaded from the OpenStreetmap website: under the Export menu item:

Map data in osm format can be downloaded from the OpenStreetmap website.
The command line tools in the next steps don't work with .osm files, so we need to convert the map data into .osm.pbf files.
osmium the right tool for the job. The following command converts the .osm file into a .osm.pbf file:
$ osmium cat my_test_map.osm -o my_test_map.osm.pbfIf you download your maps directly in .osm.pbf format, for example from Geofabrik.de, you can skip the installation of osmium and the file conversion.
Create vector tiles
Next, vector tiles (in .mbtiles format) are created from the .osm.pbf files, which can be displayed in the browser later. This is done using the Open Map Tiles project, which you downloaded and install via Git:
$ git clone git@github.com:openmaptiles/openmaptiles.git
$ cd openmaptiles
For openmaptiles you can now adjust some settings before the vector tiles are generated: In the .env file in the opemaptiles/ folder, you can adjust the minimum and maximum zoom level of the map for example:
MIN_ZOOM=0
MAX_ZOOM=7
The higher the maximum zoom level, the more detailed the map, and the longer the rendering process takes. For example, for the map shown above, I set a zoom level of 2-18.
Now you can create the vector tile files via the following command:
$ ./quickstart.sh my_test_mapThis process can take a very long time. Depending on the set zoom levels and map area it might even take several hours.
The generated vector tiles files are then stored in openmaptiles/data/tiles.mbtiles.
Step 2: Display map
The map is embedded into a page using the MapLibreGL library. In addition, some other NodeJS tools are used (depending on the selected map style).
Creating styles
To display the map we also need so called "map styles" that tell the browser how different features of the map should look.
These are contained in a file called styles.json and describe appearance coloring and appearance of various map elements.
A specification of the mapstyles format is available on the maplibre website.
If you are not interested in writing your own map styles, you can also use predefined styles from OpenMapTiles. In this example I use the styles from OSM Bright.
For this I download the styles via git clone:
$ git clone git@github.com:openmaptiles/osm-bright-gl-style.gitCreate sprites
For many map styles, icons and symbols are also needed, for example to mark highways and businesses correctly. In the Bright-OSM Theme, these symbols are stored in the icons folder in svg format.
The command line tool spritezero-cli can combine the single SVG files to a spritesheet to optimize loading times.
You can install it globally via npm:
$ npm install -g @elastic/spritezero-cliThe following command creates a new spritesheet with all icons in the icons folder.
$ spritezero sprite@2x icons --retina && spritezero sprite iconsEach spritesheet consists of the files sprite.png and sprite.json.
.
├── icons
│   ├── ... (svg icons)
│   └── ...
├── sprite.png
└── sprite.json
Step 4: Create font files
In addition to vector tiles and style files, fonts are usually needed to display the maps properly as well.
The font files need to be in the .pbf file format. The package openmaptiles/fonts helps with the the conversion of font files from other formats (e.g. .ttf).
Download the package via git clone and install the dependencies via npm install:
$ git clone git@github.com:openmaptiles/fonts.git
$ cd fonts
$ npm install
node ./generate.js generates the pbf files in the _output folder.
Setting up the tile server
Once all the preliminary work has been completed, the next step is to display an interactive map in the browser: For this, I use a tile server software on the server side: It returns the requested map section in response to HTTP requests. For this the project I used https://github.com/maptiler/tileserver-php.
Install the tile server by uploading the following files into a publicly accessible folder of a web server (e.g. into the htdocs folder of Apache):
.htaccesstileserver.php
Next copy the created file with the vector tiles tiles.mbtiles into the same folder.
To test if everything worked you can call the address of tileserver.php in your browser, e.g.: http://localhost/tileserver.php.
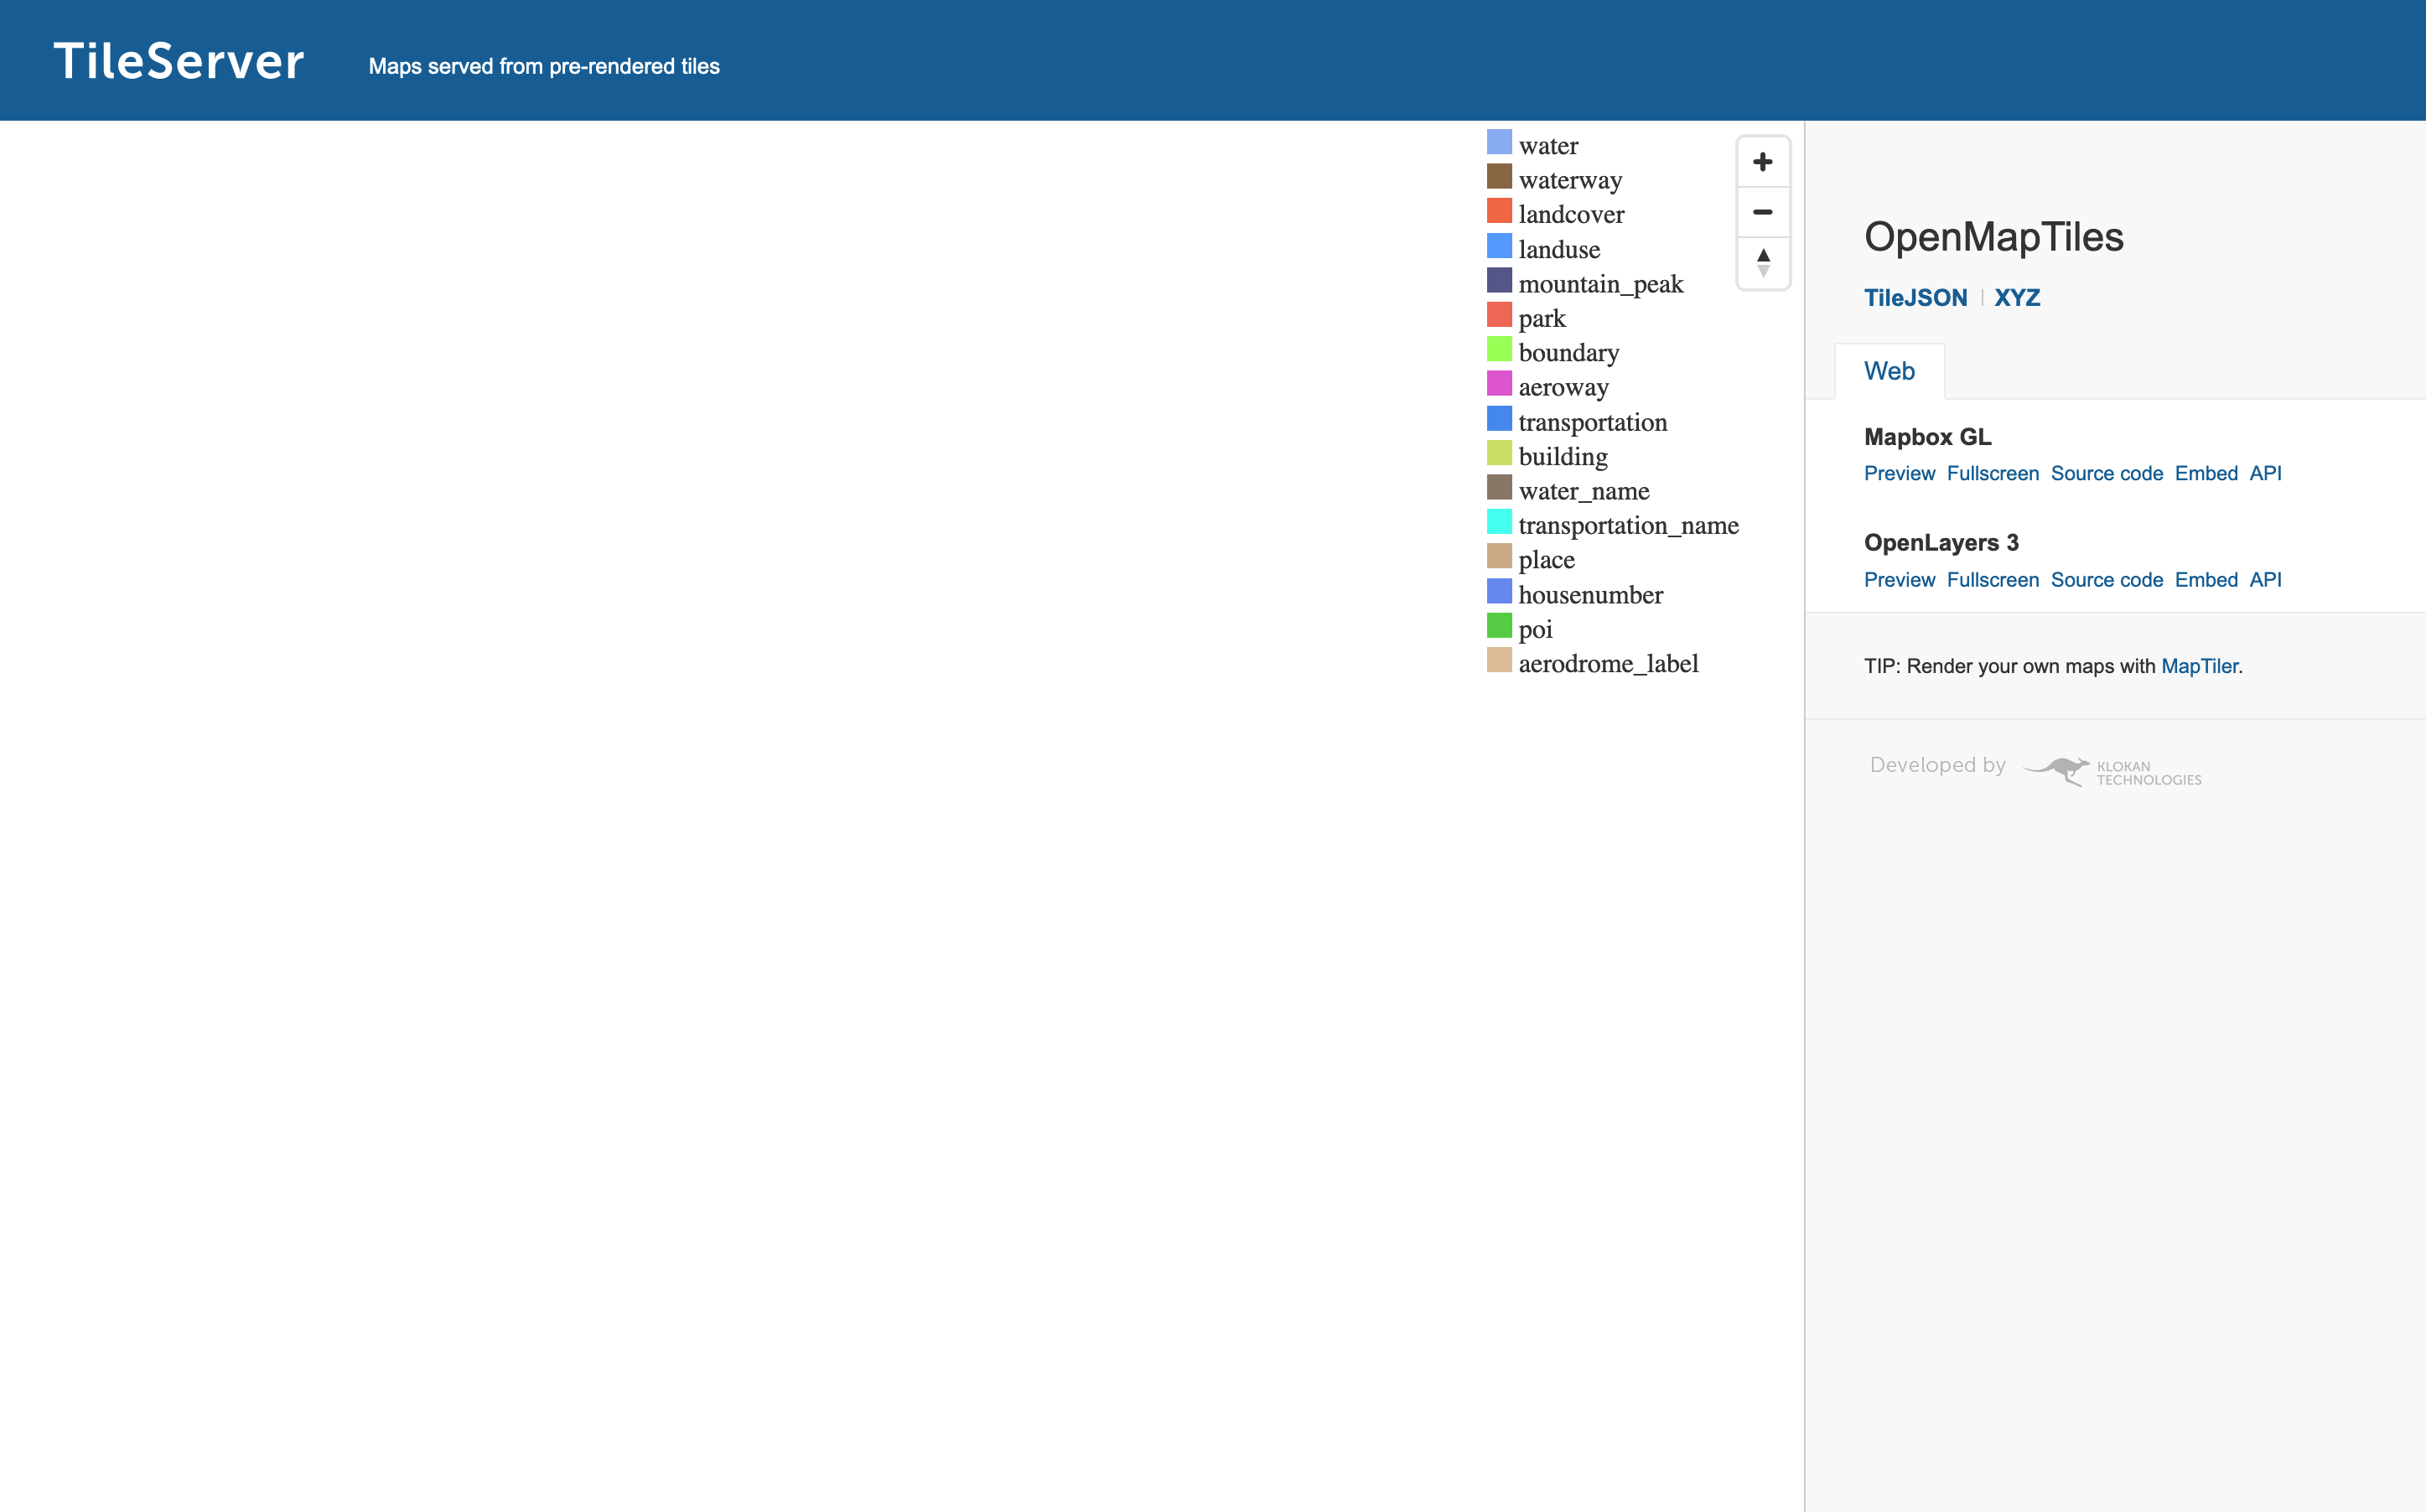
If everything worked, the tileserver interface should appear:

The Tileserver.php Interface
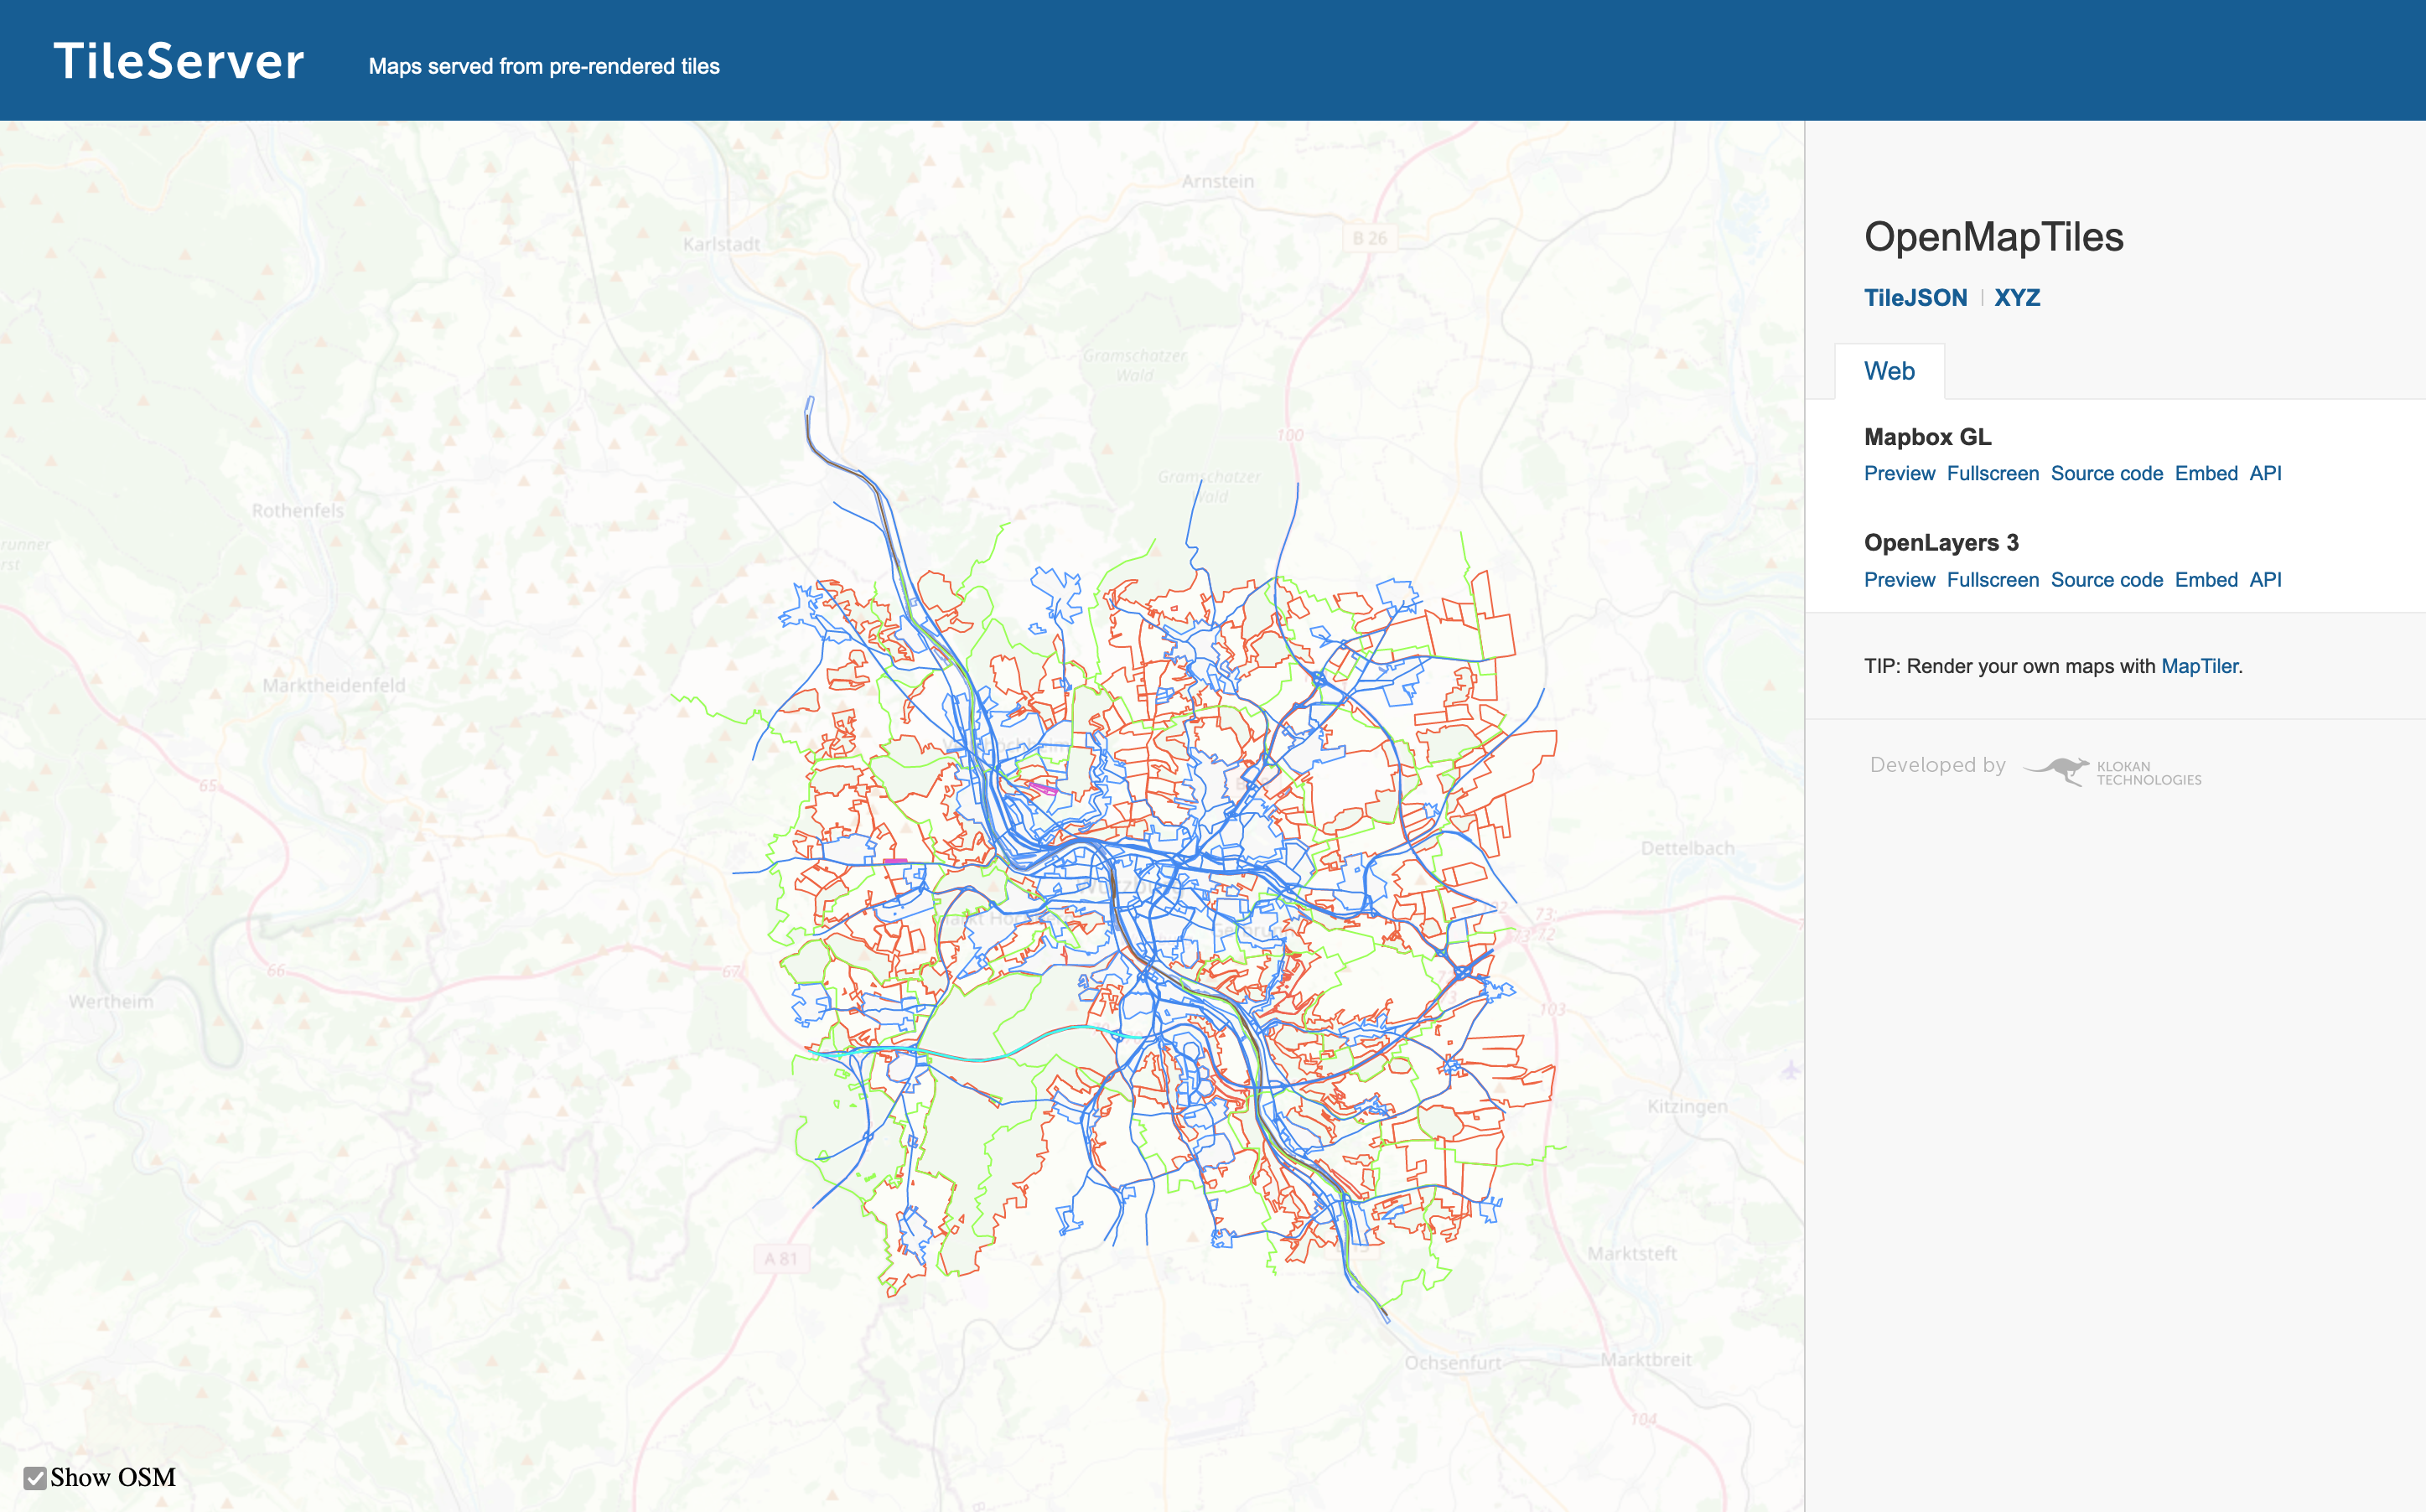
To see a preview of the created Vector Tiles, you can click on Preview in the menu on the right side under Open Layers 3 and then check "Show OSM" in the lower left corner. This makes it easier to zoom in on the rendered area of the map:

Tileserver.php Interface with map data
The next step is to upload the map styles, icons and the generated font files to the web server as well. It is not relevant in which folder the files are stored, it is only important that the uploaded files can be accessed via a URL.
If map styles, icons and font files are uploaded, they have to be linked correctly within in the map style file styles.json with an absolute URL
Edit styles.json file as follows:
- Under
sources.openmaptiles.urlthe URL to the map information on the tile server is entered, e.g.:"http://localhost/tileserver/tiles.json". - Under
glyphsthe URL to the font files is entered, e.g.:http://localhost/fonts/{fontstack}/{range}.pbf. The values{fontstack}and{range}will be replaced later programmatically. - Under
sprite: the folder URL of the icons is entered, e.g.:http://localhost/icons.
All in all, the the server directory tree should now look something like this:
.
├── fonts
│   ├── ...
│   └── ...
├── mapstyle.php
├── styles
│   ├── sprite.json
│   ├── sprite.png
│   ├── sprite@2x.json
│   ├── sprite@2x.png
│   └── style.json
└── tiles
    ├── tileserver.php
    └── tiles.mbtiles
Embed via MapLibreGL
The last step is to display the interactive map. For this I use the maplibre-gl-js Javascript library:
<!doctype html>
<html>
	<head>
		<meta charset="utf-8" />
		<title>Self hosted OSM-Widget</title>
		<style>
			#map { width: 100%; height: 90vh; }
		</style>
	</head>
	<body>
		<div id="map"></div>
	<script src="maplibre-gl.js"></script>
	<script>
const map = new maplibregl.Map( {
	container: '#map',
	style: 'assets/styles.json',
	center: new maplibregl.LngLat( 9.928392619016336, 49.79308196069323 ),
	zoom: 16
} );

const marker = new maplibregl.Marker( { color: '#000000' } )
	.setLngLat( [ 9.928392619016336, 49.79308196069323 ] )
	.addTo( map );
		</script>
	</body>
</html>